In the stock market, price patterns can help traders predict future price movements. Two important reversal patterns that investors often look for are Double Tops and Double Bottoms. These patterns indicate that a trend is likely to change direction, signaling a potential opportunity for profit or loss prevention.
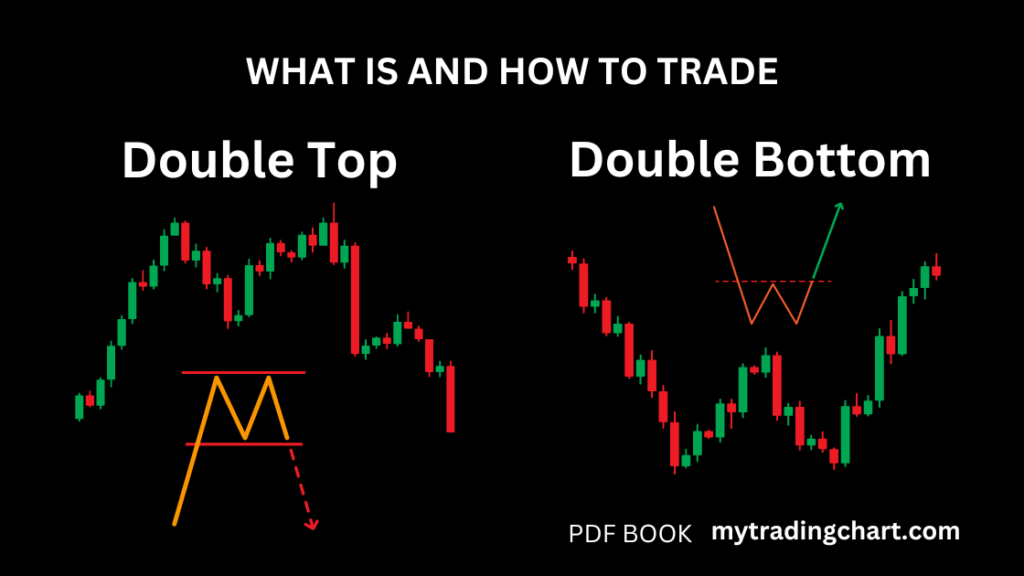
What is a Double Top?
A Double Top is a bearish reversal pattern that signals the end of an uptrend. It appears when a stock reaches a high price level, pulls back, and then rises again to the same level before falling again. Essentially, it forms two peaks at roughly the same price level, creating an “M” shape on the chart.
What is a Double Bottom?
On the flip side, a Double Bottom is a bullish reversal pattern that signals the end of a downtrend. It occurs when a stock falls to a certain price, rebounds, and then falls again to approximately the same price level before reversing course. This creates a “W” shape on the chart.
How to Trade Double Tops and Bottoms:
Traders often use these patterns to enter or exit trades. For a Double Top, once the price drops below the lowest point between the peaks, traders may sell or short the stock, expecting a further decline. For a Double Bottom, once the price rises above the highest point between the troughs, traders may buy, anticipating a price increase.
Example of Double Top and Double Bottom:
Double Top: Suppose a stock called XYZ rises from ₹50 to ₹70, then falls to ₹60. After this pullback, it again climbs to ₹70 and then begins to fall again. The two peaks at ₹70 form the Double Top pattern. If the stock drops below ₹60, it is a signal that the trend might shift from upward to downward, and traders may consider selling.
Double Bottom: Consider the stock ABC, which falls from ₹80 to ₹50, then rebounds to ₹60. After this rebound, the stock drops again to ₹50 and starts rising again. The two troughs at ₹50 form the Double Bottom pattern. When the stock breaks above ₹60, it signals a potential upward trend, and traders may decide to buy.
Conclusion:
Both Double Tops and Double Bottoms are powerful chart patterns that help traders identify potential trend reversals. Recognizing these patterns and confirming them with price action can significantly improve trading strategies. Always combine these patterns with other technical analysis tools for better accuracy in predicting future price movements.
– Ketaki Dandekar (Team Arthology)
Read more about Double Tops and Double Bottoms here – https://www.investopedia.com/terms/d/double-top-and-bottom.asp