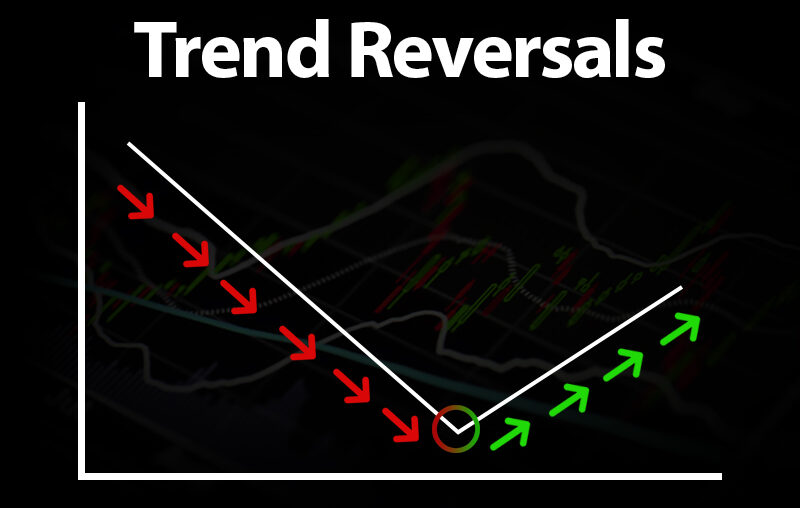
Trading Price action reversal is a popular strategy that relies on the movement of price rather than indicators or other technical tools. One of the most effective techniques within this approach is trading price action reversals. Recognizing these reversals early can give traders an opportunity to enter positions at favorable prices.
What is Price Action Reversal?
Price action reversals happen when a stock that has been moving in one direction suddenly changes its trend. After an upward trend, the price may suddenly start to fall, indicating a potential reversal. These reversals occur due to various factors such as market sentiment, news, or overbought/oversold conditions.
Recognizing Reversal Patterns:
There are several key reversal patterns traders look for in price action, such as:
- Engulfing Candlestick: This is when a large candlestick completely engulfs the previous smaller candlestick. A bullish engulfing indicates a potential upward reversal, while a bearish engulfing suggests a downward reversal.
- Double Top/Bottom: These patterns occur when a stock reaches a certain high or low twice, failing to break through, which often signals a reversal. A double top indicates a reversal to the downside, while a double bottom suggests a move upward.
- Hammer and Shooting Star: These are single candlestick patterns. A hammer at the bottom of a downtrend often signals a reversal to the upside, and a shooting star at the top of an uptrend can signal a reversal to the downside.
Example of a Price Action Reversal:
Let’s say you are watching Stock XYZ, which has been in a consistent downtrend for several days. The price hits a support level and forms a hammer candlestick. A hammer is characterized by a small body at the top with a long lower wick, indicating that sellers drove the price down during the session but buyers pushed it back up before the close.
This formation suggests that the selling pressure might be weakening, and buyers could take control. If the price moves above the high of the hammer candle, it confirms the reversal, and you could consider entering a long (buy) position, expecting the price to move upwards.
Risks:
While trading price action reversals can be profitable, it comes with risks. One key risk is the false reversal. Sometimes, a stock may show signs of a reversal, but the trend continues in the same direction. This can lead to losses if a trader enters a trade based on incorrect signals.
Another risk is the timing of entry and exit. Price action reversal signals are not always immediate, and traders may enter too early or too late, missing the optimal price point. Additionally, market volatility can cause abrupt movements that invalidate a reversal, leading to unexpected losses.
Conclusion:
Price action reversal trading offers a simple yet effective way to make trading decisions based on the natural movement of the market. By carefully observing candlestick patterns, support and resistance levels, and trendlines, traders can make informed decisions and increase their chances of success. Like any trading strategy, it’s essential to manage risk, as not every reversal will lead to a profitable trade.
– Ketaki Dandekar (Team Arthology)
Read more about Trading Price Action Reversal here – https://www.investopedia.com/terms/r/reversal.asp
